
The heart muscle possesses the property of automatic rhythmic contraction. The impulses originating in the conducting system spread throughout the myocardium resulting in excitation of the muscle fibres. This results in weak electric currents which spread throughout the entire body. These currents can be recorded by placing electrodes at various positions on the body and connecting them to an electrocardiographic apparatus.
The Electrocardiogram (ECG) is a linear graph of voltage fluctuations produced by the myocardium.
Electrophysiology
In normal cells, there is an electric potential difference of 90 millivolts across the cell membrane, due to disodium pump mechanism. The inside having negative and outside having positive charge.
When the cell is stimulated, there occurs a migration of ions i.e. positive shifting inside and negative coming outside, thus reversing the polarity, and this process is called depolarisation. During recovery, the positive ions go back from inside to outer surface and negative ions enter into the cells and this process is called repolarisation.
An electrode placed facing the wave of depolarisation will record +ve or upard deflection, whereas an electrode facing away from the current will record –ve or downward deflection.
PQRST waves
- P wave represents atrial depolarisation.
- QRS wave represents ventricular depolarisation.
- T wave represents ventricular repolarisation (Repolarisation can occur in the same or opposite direction as depolarisation).
The depolarisation of the heart begins at the SA node. This wave of depolarisation spreads over the atrium and reaches AV node; at the AV node there is a delay in conduction. The wave of depolarisation spreads to the Bundle of His and Purkinje’s fibres.
At first stimulating the septum, then the apex of left ventricle (from the endocardium to the epicardium) and finally the Rt. ventricle and the base of the heart.
Repolarisation takes place in the reverse direction from the epicardium to the endocardium. During this period the myocardium is in a refractory state and does not respond to additional stimuli. After this the SA node again initiates the depolarisation and this process continues at regular interval.
Electrocardiographic leads
The common 12 lead ECG consists of: 3 bipolar limb leads, 3 augmented unipolar limb leads, and 6 unipolar precordial (Chest)leads.
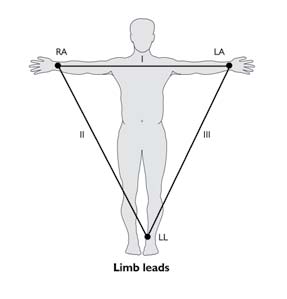
1. Bipolar leads:
The three standard bipolar limb leads (I, II, III) detect variation in the potential difference between two points in the frontal plane of the body.
The electrodes are applied to the RA (Right arm); LA (Left arm): and LL (Left leg); usually they are applied just above the wrist and ankles.
Lead I: shows the potential difference between RA and LA
Lead II: RA and LL
Lead III: LA and LL
Relation between the bipolar limb leads: Kirchoff ’s law: It states that the algebraic sum of all the potential differences in a closed circuit equals to zero.
Lead I + II + III = 0
If the polarity of lead II is reversed by Einthoven I-II+III = O i.e. II = I This is Einthoven’s equation.
2. Unipolar augmented limbs leads: Here two electrodes are employed – Indifferent electrode and exploring electrode.
The potential recorded by indifferent electrode is zero (RA + LA+LL).
So that only the activity of exploring electrode is recorded. The terminal point of indifferent electrode is the same i.e. (RA+LA+LL) and equals to zero. Hence, the potential recorded is the actual potential of RA. These three leads are designated as VR, VL, and VF (Indifferent Electrode).
By a slight change in the technique, the voltage of the leads can be increased to 50% and thus these leads are called augmented leads as: aVR, aVL ,and aVF.
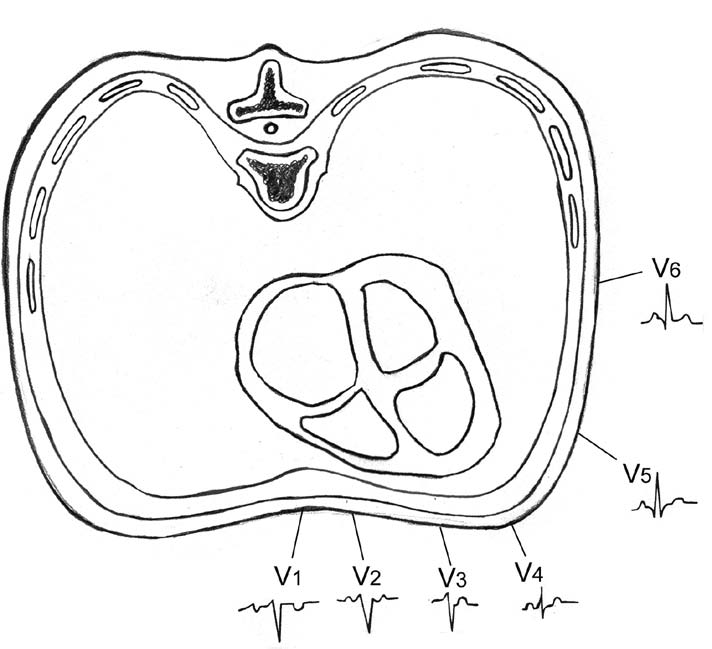
3. Unipolar precordial (chest) leads: The six chest leads (unipolar) detect the electrical potential at specific points on the chest wall in the horizontal plane of the body. The common precordial positions used are as follows:
V1 : Fourth intercostal space at the right sternal border.
V2 : Fourth intercostal space at the left sternal border.
V3 : Equidistant between V2 and V4.
V4 : Fifth left intercostal space in the midclavicular line.
V5 : In the anterior axillary line in the same horizontal plane as V4.
V6 : In the midaxillary line in the same horizontal plane as V4.
ECG paper
The paper upon which the ECG is recorded is ruled in lines 1 mm apart both horizontally and vertically. Each fifth line in both directions is heavier than the rest. The vertical axis represents voltage. With normal standardisation each 1 mm represents 0.1 mv. The horizontal axis represents time with normal speed 1 mm represents 0.04 sec. i.e. each 5 mm. represents 0.2 sec. and in one minute ECG paper moves by 300 thick lines or 1500 mm.
Precautions while taking an ECG
- Patient should be asked to lie comfortably and should be relaxed.
- Electrodes must be placed in proper contact with the skin.
- Connections should be checked properly, as wrong connections can completely alter the recording and may mislead.
- Machine should be on standards so that 1 mv produces a deflection of 1 cm.
- Patient and the machine must be properly grounded to avoid interference from alternating currents.
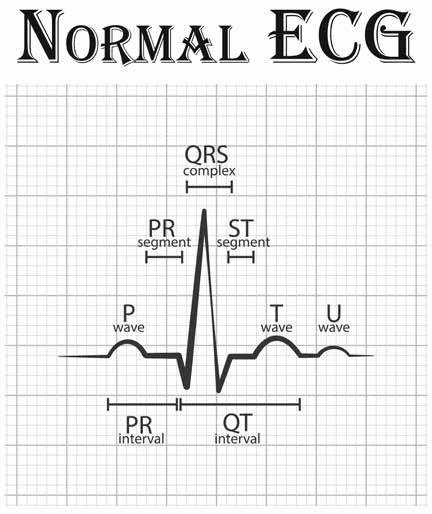
Waves and complexes
P wave
Produced by atrial depolarisation. This is best seen in lead II and normally does not exceed 3mm in height (0.3 mv) or 3 mm horizontally (0.12 sec). P wave is upright in all leads except aVR.
Abnormalities
- P wave is absent in atrial fibrillation, nodal rhythm, sino-atrial block, hyperkalemia.
- P wave is inverted in lead I in Dextrocardia, incorrect electrode placement, retrograde atrial activation.
- P wave is wide and notched (p-mitrale) in Left atrial enlargement.
- P wave is tall and peaked (p-pulmonale) in Rt. atrial enlargement.
QRS complex
Produced by ventricular depolarisation.
Q wave: It is the negative deflection. It is due to depolarization of the ventricular septum from left to right.
R wave: It is the first positive deflection of the QRS complex. It represents depolarization of the ventricles, at first the antero-septal portion followed by the major ventricular muscle mass.
S wave: It is the first negative deflection of the QRS complex. It is due to depolarization of the postero-basal part of the left ventricle, pulmonary conus, and the upper most part of the interventricular septum.
Causes of prolonged QRS complex are:
Bundle branch block
Wolff – Parkinson – white syndrome
Hypokalemia
T wave
It is produced by ventricular repolarization and is normally upright except in leads III, aVF, V1, and V2.
Abnormalities
- T wave is inverted in myocardial ischaemia.
- T wave is tall in hyperkalemia, true posterior wall myocardial infarction (in leads VI, and V2), and acute sub-endocardial infarction.
- T wave is flat in thick chest walled individuals, emphysema, myxoedma, myocarditis, myocardial ischemia, hypocalcemia, pericardial effusion, anxiety state, and hyperventilation.
U wave
Represents the slow repolarization of the Purkinje’s fibres, the papillary muscles or the ventricular septum. It follows T wave and precedes P wave of the next cycle. It is upright in most of the leads.
Abnormalities
U wave is inverted in II, III, V1 and V2; it is transiently inverted in angina, acute pulmonary embolism, left ventricular overload, digitalis effect, myocardial infarction (sometimes).
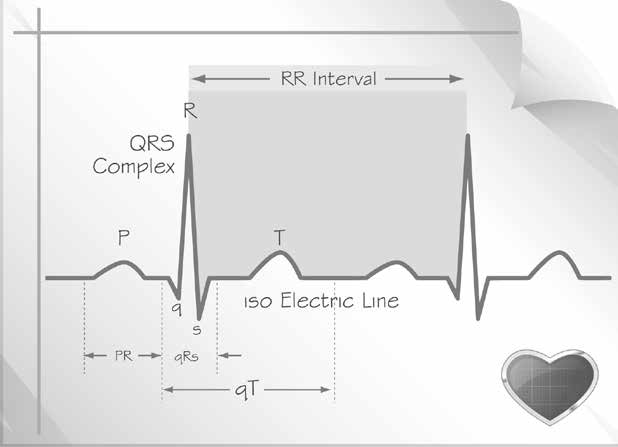
P-P and R-R interval
When there is sinus rhythm, the P-P and R-R interval are equal. They are used for the calculation of heart rate. P-P interval represents atrial rate. R-R interval represents – ventricular rate.
P-R interval
It is measured from the beginning of the P wave to the beginning of the QRS complex. It represents the time interval between atrial and ventricular depolarisation. The normal PR interval ranges from 0.12-0.20 seconds. Average 0.16 sec.
Abnormalities
- PR interval is increased in rheumatic fever, ischaemic heart disease, following digitalis, with ASD and mumps.
- PR interval is decreased in – WPW and LGL syndromes, AV nodal rhythm.
QRS interval
It is the time taken for ventricular depolarization and is measured from the beginning of the Q wave to the end of S wave. Normal QRS interval is 0.1 sec.
Abnormalities
- QRS interval more than 0.12 sec. indicates:
- Bundle branch block.
- Interventricular conduction defect.
Ventricular activation time (VAT)
Time taken by an impulse to traverse the myocardium from the endocardium to the epicardium. Measured from the beginning of the Q wave to the peak of the R wave. Normal VAT is 0.03 sec in V1 and V2, and 0.05 sec in V5, V6.
Abnormalities
VAT is increased in bundle branch block.
QT interval
Represents the duration of ventricular systole and is measured from the beginning of the Q wave to the end of T wave. It varies with the heart rate. Normally it does not exceed 0.42 sec.
Abnormalities
- QT interval is increased in acute rheumatic carditis, myocarditis, hypokalemia, hypocalcemia, cerebrovascular accidents, following quinidine therapy, cardiac syncope.
- QT interval is decreased in hypercalcemia, following digitalis therapy.
ST junction
The point at which QRS complex ends and the ST segment starts.
ST segment
Is measured from the ST junction to the beginning of the T wave. It is usually isoelectric. It represents the time between ventricular depolarization and repolarization.
Abnormalities
- ST segment is sagging in coronary artery disease.
- ST segment is depressed and convex upwards in strain pattern.
- ST segment is raised with convexity upwards in myocardial injury.
- ST segment is raised with concavity upwards in pericarditis.
- Mirror image of correction make in digitalis effect.
Position of heart
Rotation of the heart means anatomical alteration of the heart either normally or in diseased states. It refers more to the change in the orientation of the mean electrical force rather than a change in the anatomical position. Rotation around the antero-posterior axis reflects rotation in the frontal plane and rotation around the longitudinal axis reflects rotation in horizontal plane.
Rotation around the anteroposterior axis: The electrical position can be obtained on the frontal plane by observing QRS complex in leads aVL, aVF, V1 and V6. The heart may rotate on the anteroposterior axis and may occupy a vertical, horizontal, or intermediate position.
Vertical position: In this position a left ventricular complex will be recorded in aVF and a right ventricular complex in aVL. Hence, aVF resembles V6 and aVL resembles V1. This position is seen in thin, tall individuals, and those with cor pulmonale.
Horizontal position: In this position a left ventricular complex will be recorded in lead aVL and a right ventricular complex in aVF. Hence aVL resembles V6 and aVF resembles V1. This is seen in broad chested individuals and in left ventricular hypertrophy.
Intermediate position: This is midway between a vertical and horizontal position of the heart. Left ventricular complex is recorded in both aVL and aVF. Hence both aVL and aVF resemble V6.
Rotation around the longitudinal axis: In normal persons, there is a small R wave and prominent S wave in VI. S wave gradually becomes smaller and the R wave gradually increases from V1 to V6. In V6 there is a prominent R wave and a smaller absent S wave. The transition zone is in leads V3 and V4.
Clockwise rotation: The transmition zone is shifted to the left in V5 or V6 so that in these leads the S wave still persists.
Counter clockwise rotation: The transition zone is shifted to the right in V1 and to V2 so that in these leads there is a prominent R wave (instead of prominent S wave).
Electrical axis of the heart
Each ECG lead has a negative and positive pole. Hypothetical line joining the two poles of the lead is called axis of the lead.
The heart is situated at the centre of its electrical field, the intensity of it decreases with the distance from its centre.
Right axis deviation
Occurs when axis lies between +90° and +180°
Aetiology
- Normal variation
- During inspiration
- Dextrocardia
- Emphysema
- Right ventricular hypertrophy
- Left posterior hemi-block.
Left axis deviation
Occurs when axis lies between 0° and 120°,
Aetiology
- During expiration
- High diaphragm – ascites, obesity, pregnancy
- Left ventricular hypertrophy
- Left anterior hemi-block
- Hyperkalemia
- Emphysema
Reference: Textbook of Practice of Medicine with Homoeopathic Therapeutics by Kamal Kansal & Rakesh Kaushal