
Things that vary are called variables in statistics and can be discerned in different classes: continuous, discrete, categorical and ordinal variables. There is some overlap in this classification.
Continuous Variables are, e.g., blood glucose level, age and weight; these variables can take any value between two numbers. Continuous variables are usually measured using some kind of instrument.
Discrete variables can only take specific values, like the number of patients you see today (not 21.5). Such variables are counted.
Dichotomous variables can only take two values, like yes/no, male/female. Gender (male/female) is also a categorical variable.
Categorical variables, sometimes called nominal variables, divide a population in different categories, like male or female, blond, brunette or red-haired. The essential characteristic of a categorical variable is that there is no ordering. In homoeopathy many symptoms like a desire for different kinds of food (bread, meat, spicy) or being chilly or hot are categorical. Mind: these variables can separately also be ordinal (see below) if we discern various degrees (moderate or strong desire).
Ordinal variables have ordering, like ‘low’, ‘medium’ and ‘high’, ‘worse’ and ‘better’. Ordinal variables can be ordered, unlike variables like hair-colour or gender. There is some difference in level or grade, like in education (none, basic, university), or in desire (no desire, slight desire or strong desire).
The classification of a variable can depend on how you investigate it in research. Take the desire for food. You may be interested in the question if gender influences the desire for food because you have the impression that females prefer sweets and males prefer spices. For this purpose, you divide your population in male and female (categorical), and you ask all persons “Do you prefer sweets or spices?”. The answer ‘Sweets’ or ‘Spices’ is entered into a database as a categorical variable.
Now another research question: you want to know if the desire for spices increases if persons get older. In this case you record the age of the person as a continuous variable. The ‘Desire for spices’ is divided into ‘none’, ‘slight’, ‘medium’, ‘strong’ and ‘very strong’. This is recorded as an ordinal variable, the ordering ‘none’, then ‘very strong’ and then ‘strong’ is not allowed in an ordinal variable, it should be ‘none’, then ‘strong’ and then ‘very strong’.
The main difference between the two situations mentioned above is that the first question is qualitative, the desire for food has a different quality, and the second question is quantitative, the quality of the food (spicy) is the same but the intensity varies. In the first example, it makes no difference if you put the desire for sweets first or last. In the second example, you have to be precise in the ordering in categories. The different definitions of variables are also necessary for statistical reasons: you can calculate the mean intensity of the desire for spices, but it makes no sense to calculate the mean value of various desires of, say, spices, sweets and fat.
Homoeopathic symptoms
For us, variation in homoeopathic symptoms is extremely important when we want to assess the relationship between symptoms and results of treatment. Intuitively we know that there are different degrees of variation in various types of symptoms. We can imagine that there is a large variety of interpretations of a vague symptom like ‘Sensitivity to injustice’. What about a seemingly easy to define symptom like ‘Desire for coffee’? It seems easy to define ‘Desire for coffee’ as a minimum amount of daily intake expressed in cups. However, what to think of a two-year-old child that steals the leftovers of the coffee cups on the table? Homoeopathic doctors will interpret this as a desire for coffee because they intuitively apply their complex knowledge about the world, humans and children.
Homoeopathic symptoms depend on gender, age, profession, culture, climate, etcetera. Still, the same Repertory of homoeopathic symptoms is used all-over the world disregarding this variation, very few symptoms (like ‘Irritability’) are specified for children, let alone for profession, culture, etcetera. We know that a symptom like ‘Desire for spices’ varies greatly, even in one country like India. In daily practice the homoeopathic doctor will interpret each symptom in each patient with his clinical expertise. He knows that little children seldom steal leftovers from coffee cups, he corrects the ‘Desire for spices’ for the patient in front of him if this patient has a different cultural background.
However, once we start doing research we want to quantify things, we want to know the prevalence of ‘Desire for coffee’ in the whole population and in the specific populations responding well to homoeopathic medicines like Calcarea carbonica, Nux vomica, etcetera. Then we experience a kind of duality: we do our best to mark each patient with a desire for coffee. We take this symptom out of the whole context of the medicine picture. In a normal practice situation we are more likely to ask for a desire for coffee if we think of Nux vomica than if we think of Calcarea carbonica. If we think of Nux vomica our reaction will be “Yes, I already thought so” when the patient has a desire for coffee and other stimulants. This will probably not happen if you thought of Calcarea carbonica for this patient.
What happens if homoeopathic doctors want to do research on homoeopathic symptoms can be described by the experience of a group of homoeopathic doctors in the Netherlands (A. L. B. Rutten, 2014). To outline the context first: the Netherlands is a small country where it takes three hours by car to go from one end to the other. Cultural differences are also not very large. This group started in 1997 with consensus meetings concerning best cases of specific medicines. They discussed results (was the effect really caused by the medicine?), and the general opinion about the medicine and the symptoms that indicated the medicine. So, they were well-trained in observing and defining symptoms. Then, 10 participants of this group started with prospective research assessing six symptoms. At the beginning of the assessment consensus was reached about the description of the symptoms. The symptom ‘Recurrent herpes of the lips’ was specified as ‘more than 6 times a year’. The symptom ‘Loquacity’ was specified as ‘Loquacity apparent during consultation, or mentioned as a very important character trait’. The symptom ‘Sensitive to injustice’ was specified as ‘it influences behaviour, e.g. protest marches; turns off the television if injustice is displayed.’
We cannot decide if variation is present and how strong it is without statistics, quantifying the prevalence of the symptoms in each practice and indicating the spread of this prevalence among different practices. Figure 1 shows that the variability is larger if the symptom is more vague: the symptom ‘Recurrent herpes of the lips’ has the smallest variation (2.3% to 9.8%), the variation in ‘Loquacity’ was larger, and the variation in ‘Sensitive to injustice’ was the largest of these three symptoms. Intuitively this is easy to understand. The amount of variation, however, is remarkable: the prevalence of ‘Sensitive to injustice’ was 1.6% in one practice and 20% in another, 12.5 times more.
The variation in the symptoms ‘Loquacity’ and ‘Sensitive to injustice’ is an interesting result of this assessment. Measuring variation is the first step in the discussion, the next step is trying to explain variation. Analysing the characteristics of this assessment we see that it was prospective: the symptom was checked in every new patient. This is different from usual practice: generally most symptoms are checked if there is some indication for it. This happens, among others, if the doctor considers a medicine that is indicated by the symptom, or a medicine indicated by the symptom is in the differential prognosis.
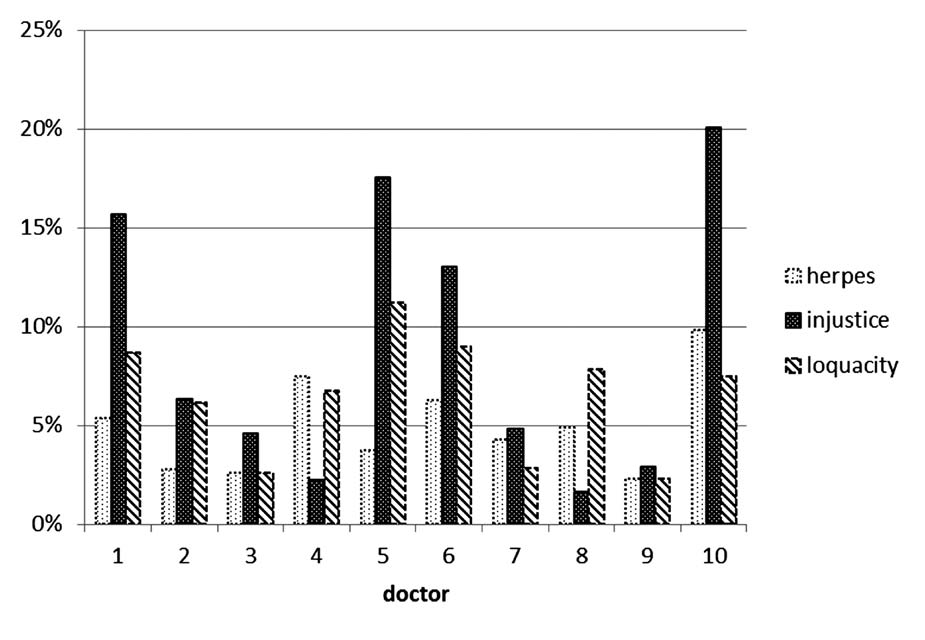
Figure 1 shows a large variation in the perception of ‘Sensitivity to injustice’ despite intensive consensus procedures. The doctors participating in this project were rather similar concerning medical and homoeopathic training and cultural background. They knew each other well and had a history of discussing many cases in an open-minded and self-critical setting. However, people are different, maybe a doctor who is loquacious himself has another perception of this symptom than others. We tried to reach a consensus within the group about the quality and quantity of symptoms. Maybe we did not pay enough attention to what we do in daily practice. In daily practice, the idea ‘this patient is loquacious’ comes up in our mind as a result of a complex process of observations and thought making a connection with a preconceived idea about loquacity. It is not only the perception that the patient talks much, but also about what he is really saying. In some cases, there is little information in a large amount of words, or much information is irrelevant. Another patient talks a lot, but with good reason because of an impressive burden of illness.
Showing variation
Figure 1 shows variation in a simple and straightforward way: the variation between the averages of observations of 10 doctors. There are other ways of representing variation which is more informative, but harder to understand. Such a representation is the boxplot. A boxplot gives you information about the spread of the data. The boxplot gives us much more information than the standard graphs representing the mean values of each observer.
If we do research we should not be afraid to show the amount of variation in our results, especially not if the variation is large. A scientific attitude requires that you search carefully for weaknesses in your research and invite others to repeat your research. Therefore you should supply all data that are necessary to replicate your study. The large variation in assessing results in our study in the Netherlands resulted in the recommendation to develop better criteria for assessing the result of treatment.
Common cause and special cause variation
We should be aware of variation but we should also control variation, if possible. For this purpose, we can discern ‘common cause’ and ‘special cause’ variation.
Common cause variation is predictable and can therefore be controlled. An example of common cause variability is culture, take the symptom ‘Desire spices’. In some countries, or even in parts of countries (like South India) a desire for spices is more common. If we define ‘Desire for spices’ as a quantity that is the same all over the world we can expect common cause variation. We can control this type of variation by relative definitions, like ‘A desire for spices so strong that it is present in less than 10% of this population’. ‘This population’ means the group of people who are comparable regarding other characteristics, like age, gender, culture, geography, etcetera.
Another example of common cause variation is mistakes in research design. These mistakes can be prevented by good analysis of the research question and by pilot studies.
Special cause variation is unpredictable and this is harder to control. We are all influenced by circumstances in our daily life and practice, or by mood swings, etcetera. In the chapter ‘Statistics in everyday practice: some definitions’ we showed that an unexpected serious but infrequent diagnosis like Multiple Sclerosis in one patient may increase your alertness for this diagnosis in following patients.
Special cause variation also happens in research and can sometimes be detected by monitoring results of our research. An example: in the Dutch prospective study assessing relationships between six homoeopathic symptoms and results of treatment the results were monitored after three months. It appeared that some doctors had much better results than others. Discussing this variation during an expert meeting it appeared that the doctors with better results thought that only good results should be recorded. We were able to correct for this special cause variation thanks to the preparedness for self-criticism of the participants in the study and the monitoring of the data.
Conclusion
Variation is in the heart of medicine and can lead to different observations and consequently to different opinions. Bringing observations of different observers together gives an idea about the spread of the variation and a better estimate of the mean or median value of a variable. The degree of variation can often become explicit and hence be discussed by applying statistics. Showing and quantifying variation gives us the opportunity to discuss the causes of variation resulting in the possible improvement of daily practice.
Reference: Fundamentals of Statistics & Clinical Research in Homoeopathy by Lex Rutten & Martine